Summary
Examining Weather Trends
This project is the culimation of learning using API's to pull relevant
information from OpenWeather and Google's API.
The project consists of two parts. The first uses OpenWeather's API to
pull weather data from a large list of cities pulled from the Citipi API.
In order to do so, a list of random latitude and longitude values are created
and passed into the Citipi API. The nearest city is then matched with the
latitude and longitude if possible.
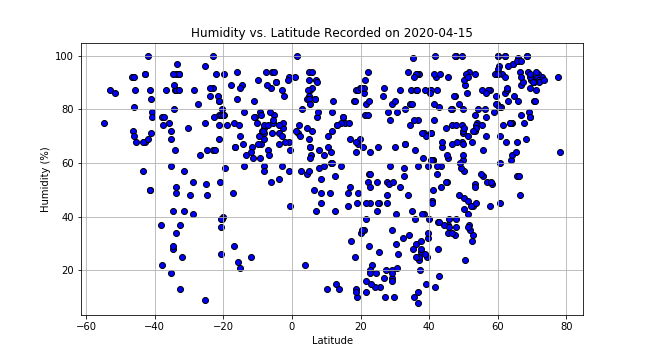
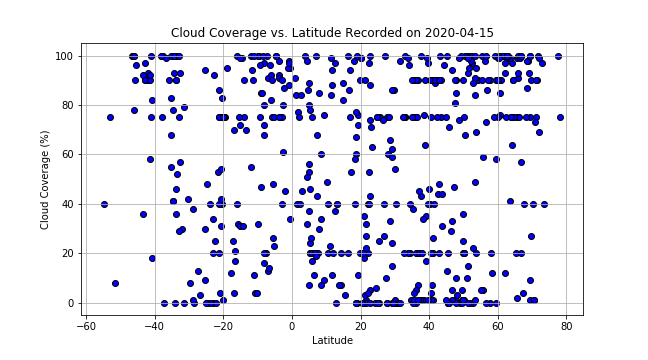
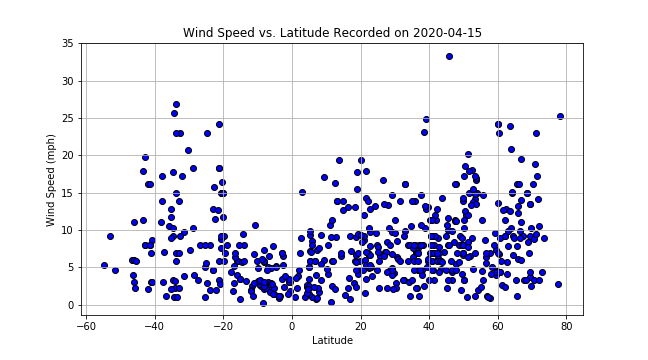
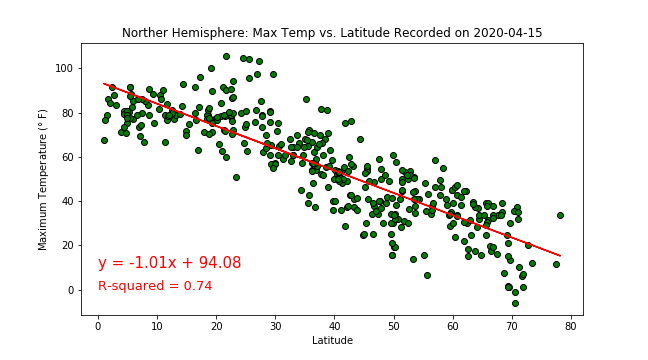
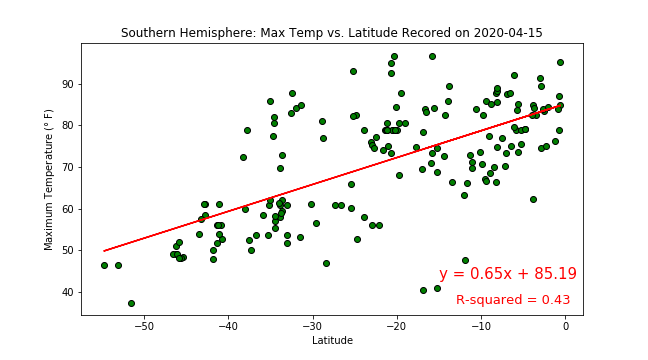
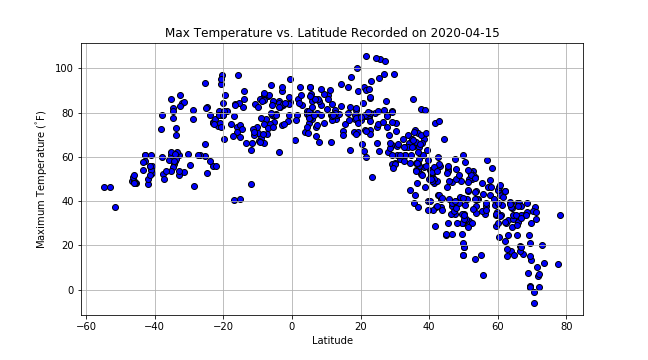
The raw data is converted into a pandas dataframe, from which data plots
and analysis were performed. The most relevant plots are included.
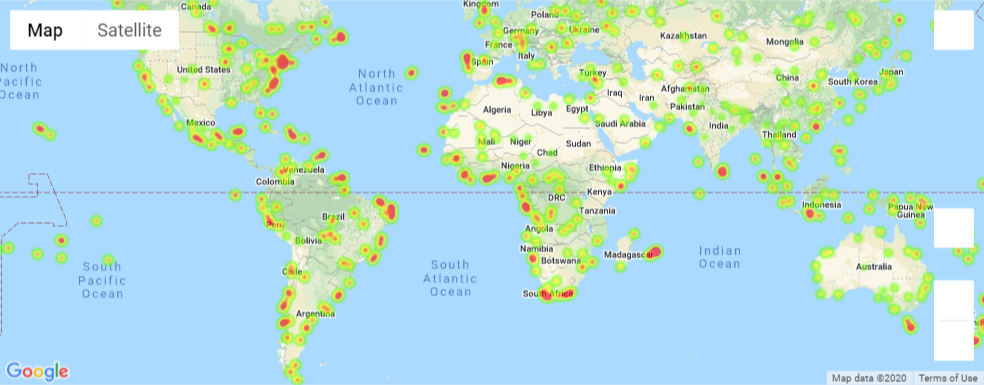
The second part uses Google's API and the data from part one to create two
heatmaps. The first heatmap uses humidity values as a weight to create a
heatmap of the most humid locations with the given data. The second heatmap
uses specific weather criteria to locate the best vacation spots. Using Google's
API, a marker with hotel information was then placed on the map.
Visualizations